Signals and thresholds
Signal tree
Drag a signal from the tree at the bottom left onto a plot in the Live tab. Signals the controller declares are at the top; built-in signals are under Built-in. For per-joint signals, expand the group and pick one joint at a time.
| Group | Kind | Signals |
|---|---|---|
Controller signals (such as error, eso_) | One sample per control cycle | Whatever the controller declares |
rt_ | Raw data, one sample per control cycle | Per joint: actual position, velocity and torque (actual_, actual_, actual_), commanded position and torque (command_, command_); bus cycle time and cycle error |
rt_ | Diagnostics aggregated over a window of about 1 second | Maximum and mean time of the control loop and bus cycle, overrun count, command update latency, EtherCAT missed-response count and more |
ft_ | Only on robots with a tool F/T sensor. About 100 Hz | Force force x/, torque torque x/ (sensor frame, no gravity compensation) |
actual_ is estimated from motor current, not measured by a torque sensor. In rt_, …_ is the worst cycle in the 1-second window and …_ is the window average.
F/T sensor signals
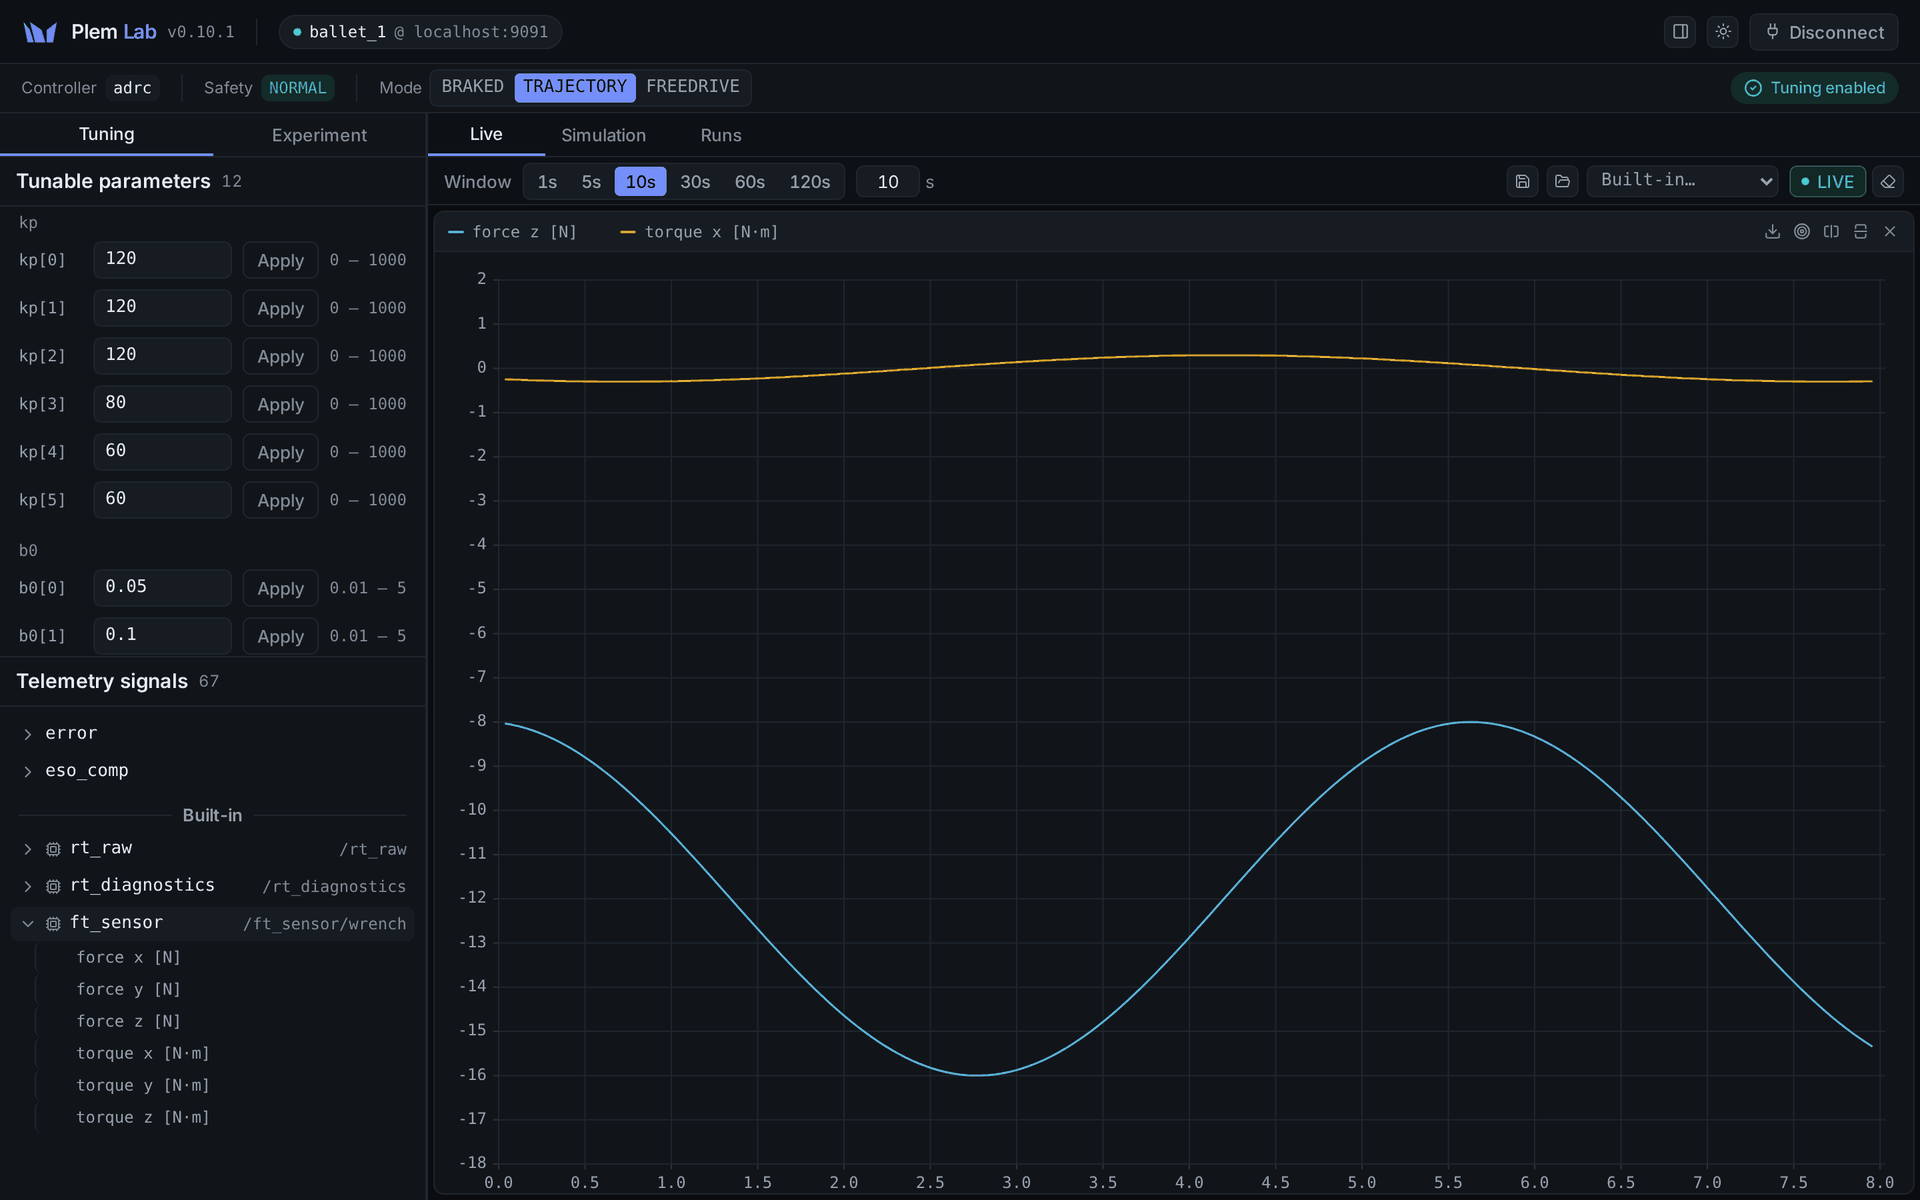
- The
ft_group appears only after the first reading of this connection arrives. It does not appear on robots without a sensor, and after a reconnect it hides again until the next reading.sensor - Stretches where the sensor sent invalid values (cable unplugged, overload, frozen value) are dropped, not drawn as 0. The plot bridges them with a straight line, exported files leave them empty, and threshold dwell time does not count across them.
- F/T signals have no gap chip.
- Export them like the other built-in signals, with the pane's download button. Run & capture recordings do not include them.
- A layout that contains
ft_opens without a warning on a robot without a sensor; that signal just stays empty.sensor
For sensor setup and zeroing, see F/T sensor.
Working with plots
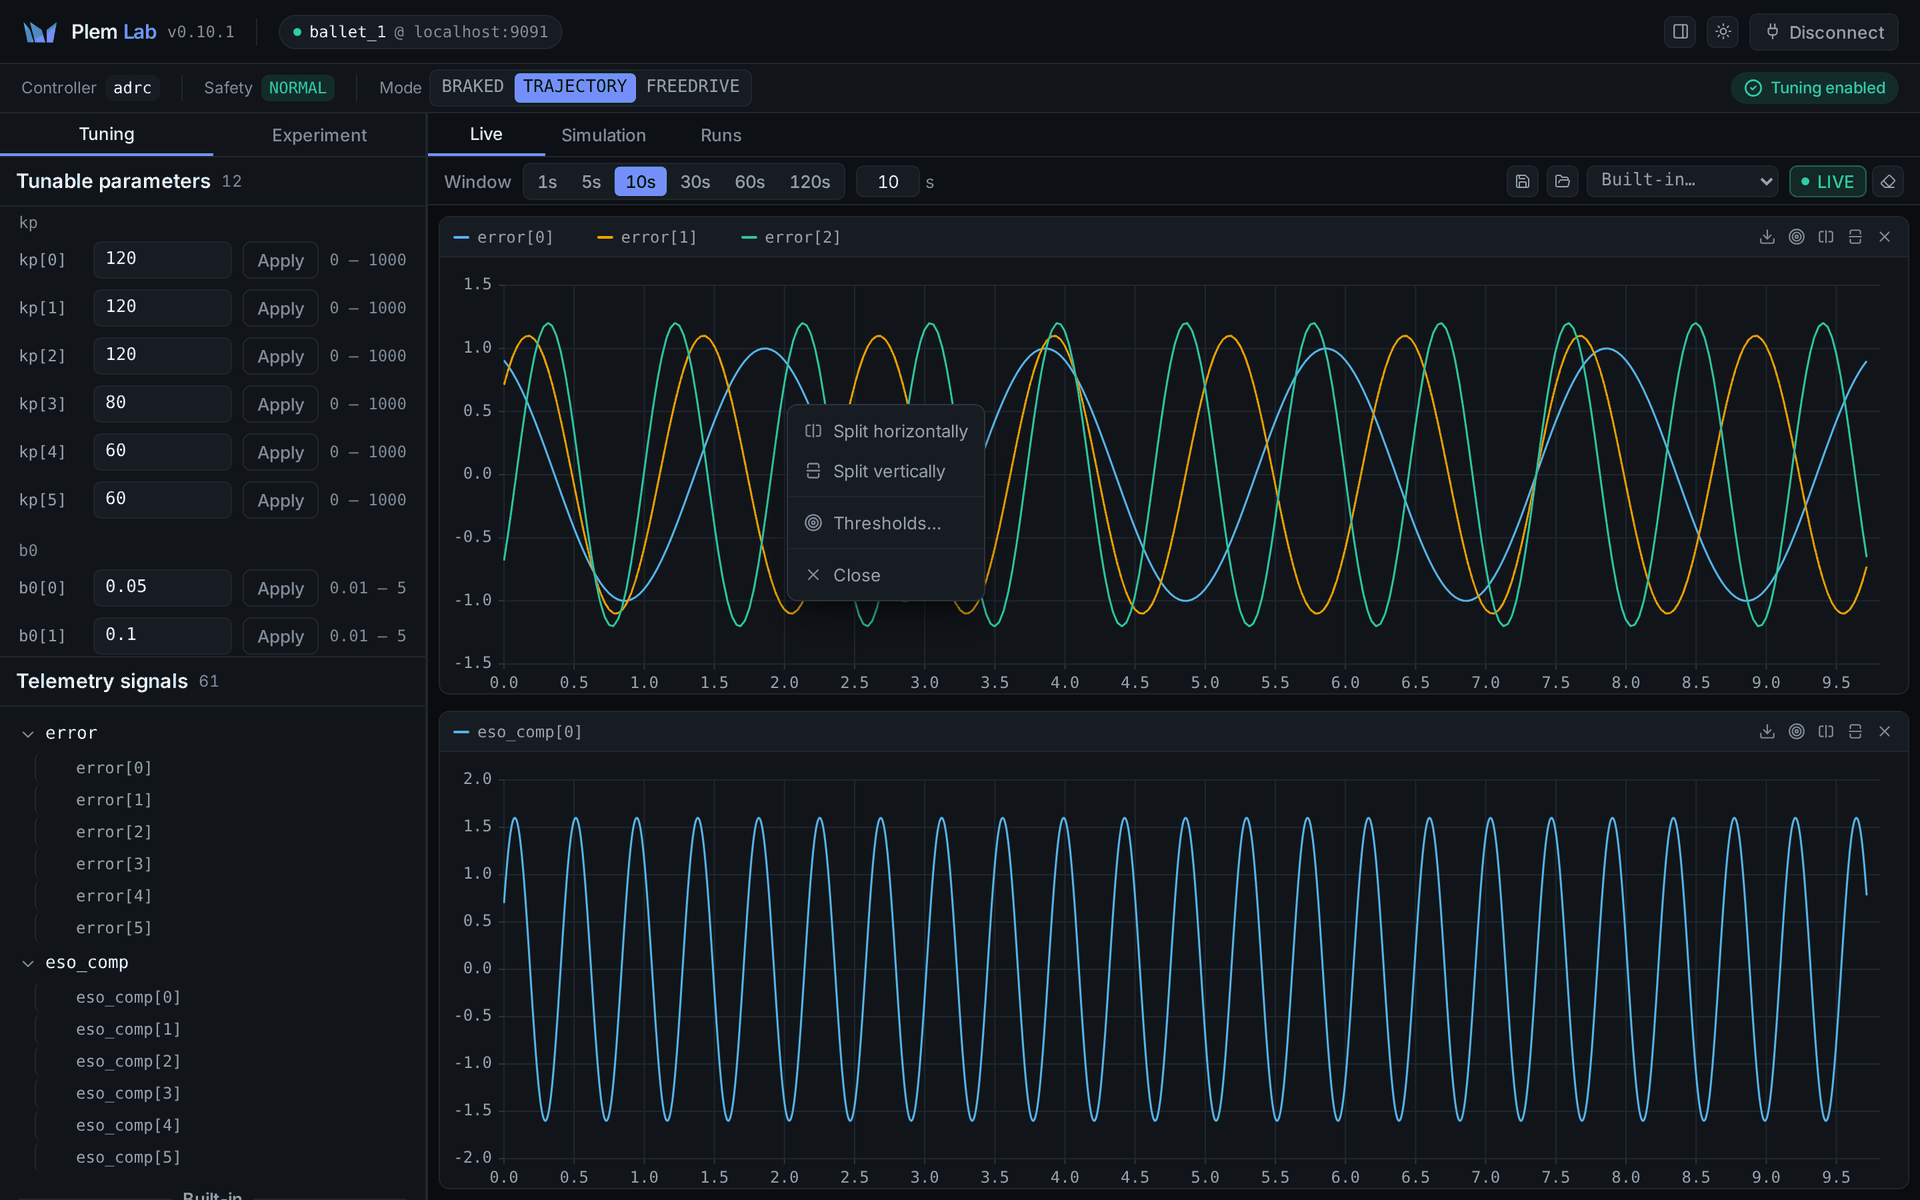
| To | Do this |
|---|---|
| Change the time window | The 1s … 120s buttons at the top, or type a number (1–120 seconds) |
| Pause and inspect | Drag on a plot to zoom; this pauses the view (Paused · data kept · drag to zoom). Double-click or Resume to go live again |
| Read values | Hover over the plot to see each signal's value |
| Split a plot | The buttons at the pane's top right, or right-click → Split horizontally / Split vertically |
| Hide or remove a signal | Click its chip on the pane to hide it (the axis stays). The chip's ✕ removes it |
| Clear | The eraser at the top discards the data in every plot |
| Export | The pane's download button saves that pane's signals as CSV and JSON |
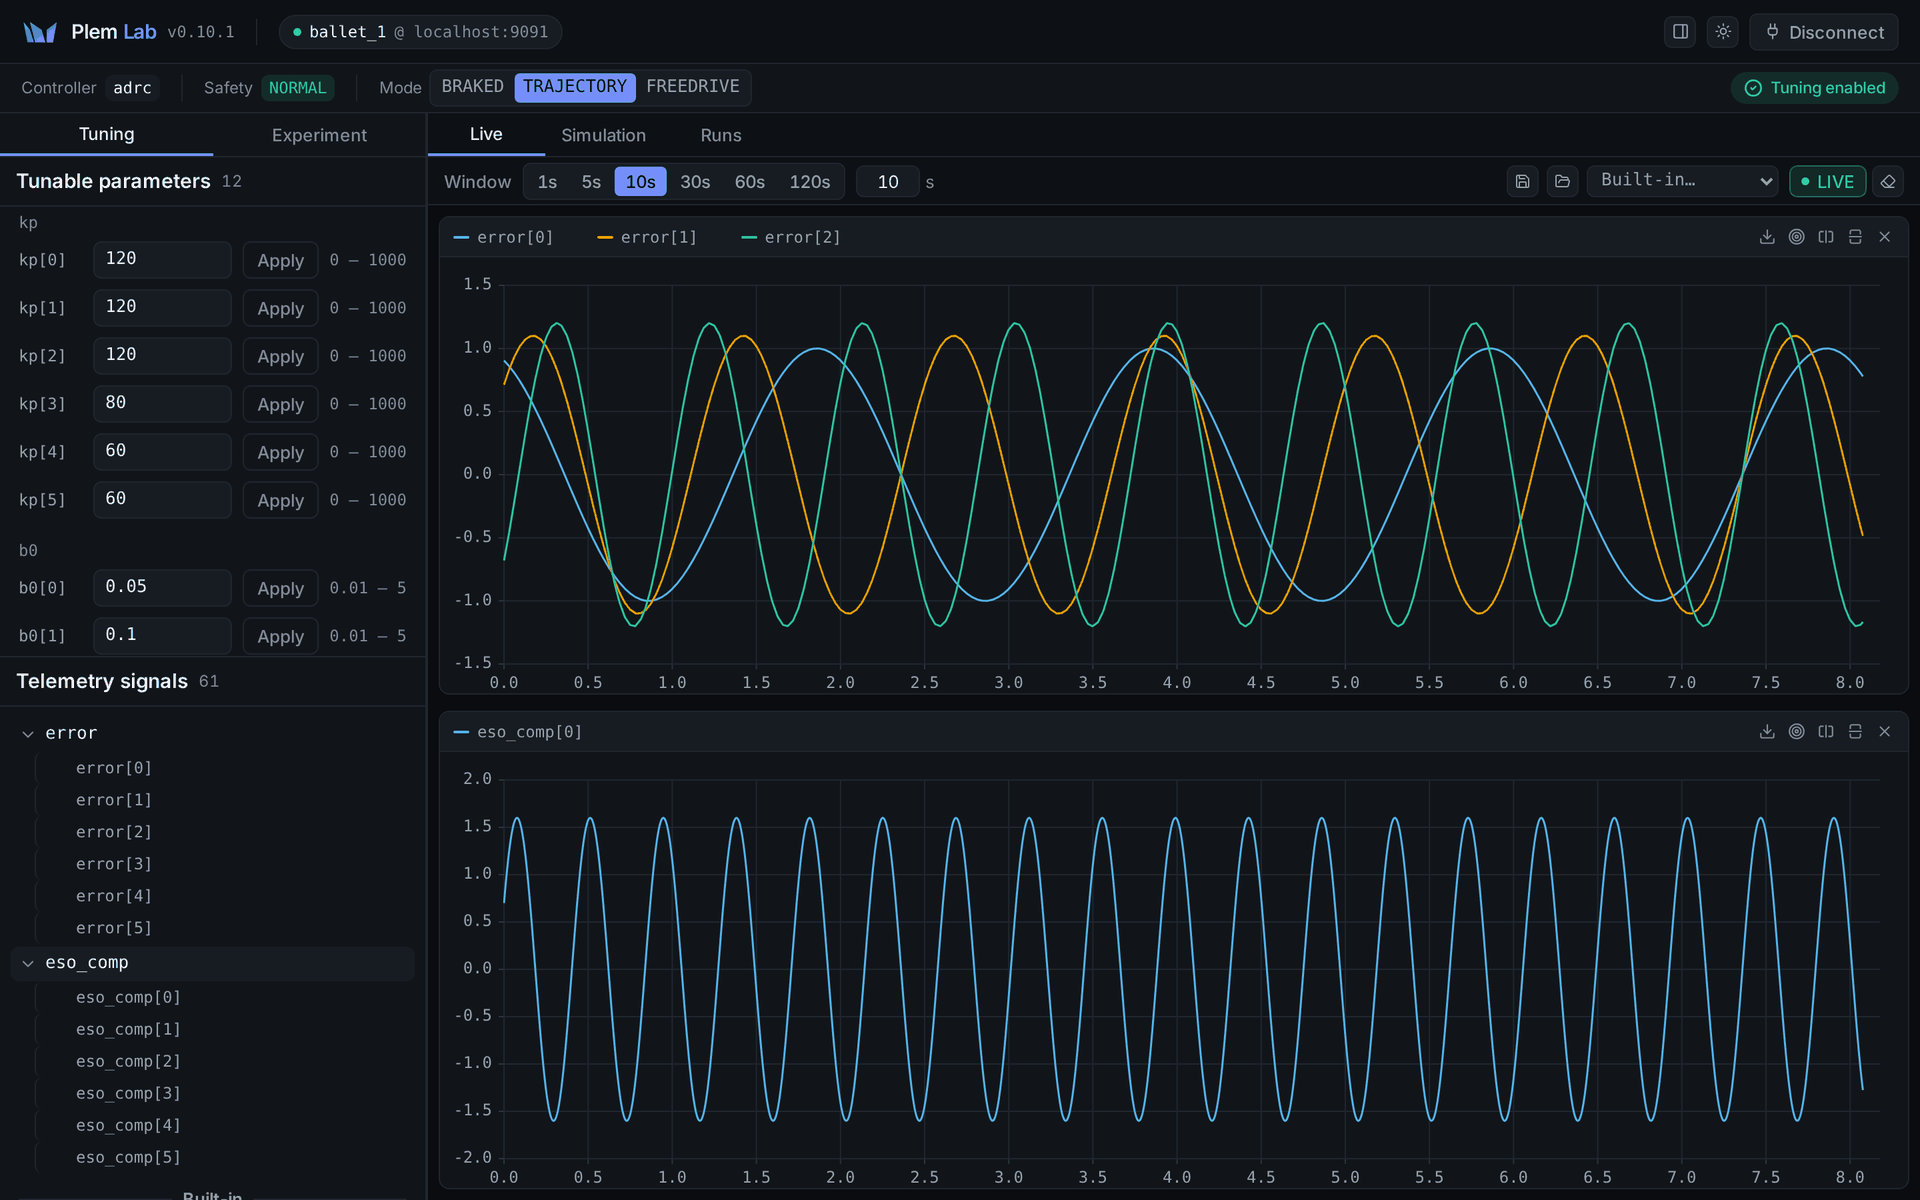
- Data keeps accumulating while the view is paused.
- The gap chips at the top show transport gaps. The controller signal chip shows the number of gaps and the time missing; the
rt_chip shows the number of samples lost.raw - Over a wide window the plot is drawn from a summary, but recording and threshold checks use the data as received.
- Controller signal amplitudes have no physical unit. Only time (s), percentages and the built-in timing signals (µs, ns) carry units.
- When the robot is BRAKED, the tab shows
BRAKED — no live telemetry. Switch to TRAJECTORY to stream signals.
Saving layouts
You can save the pane arrangement, signals, threshold bands and time window to a JSON file and load it again with the save and open buttons at the top. Built-in… offers ready-made layouts, such as a cycle jitter watch. If a loaded signal is not in the current controller, Lab skips that signal and tells you.
Thresholds: convergence and violation
Put a band on a signal and the console judges it for you. Add one with the pane's target button, or right-click → Thresholds….
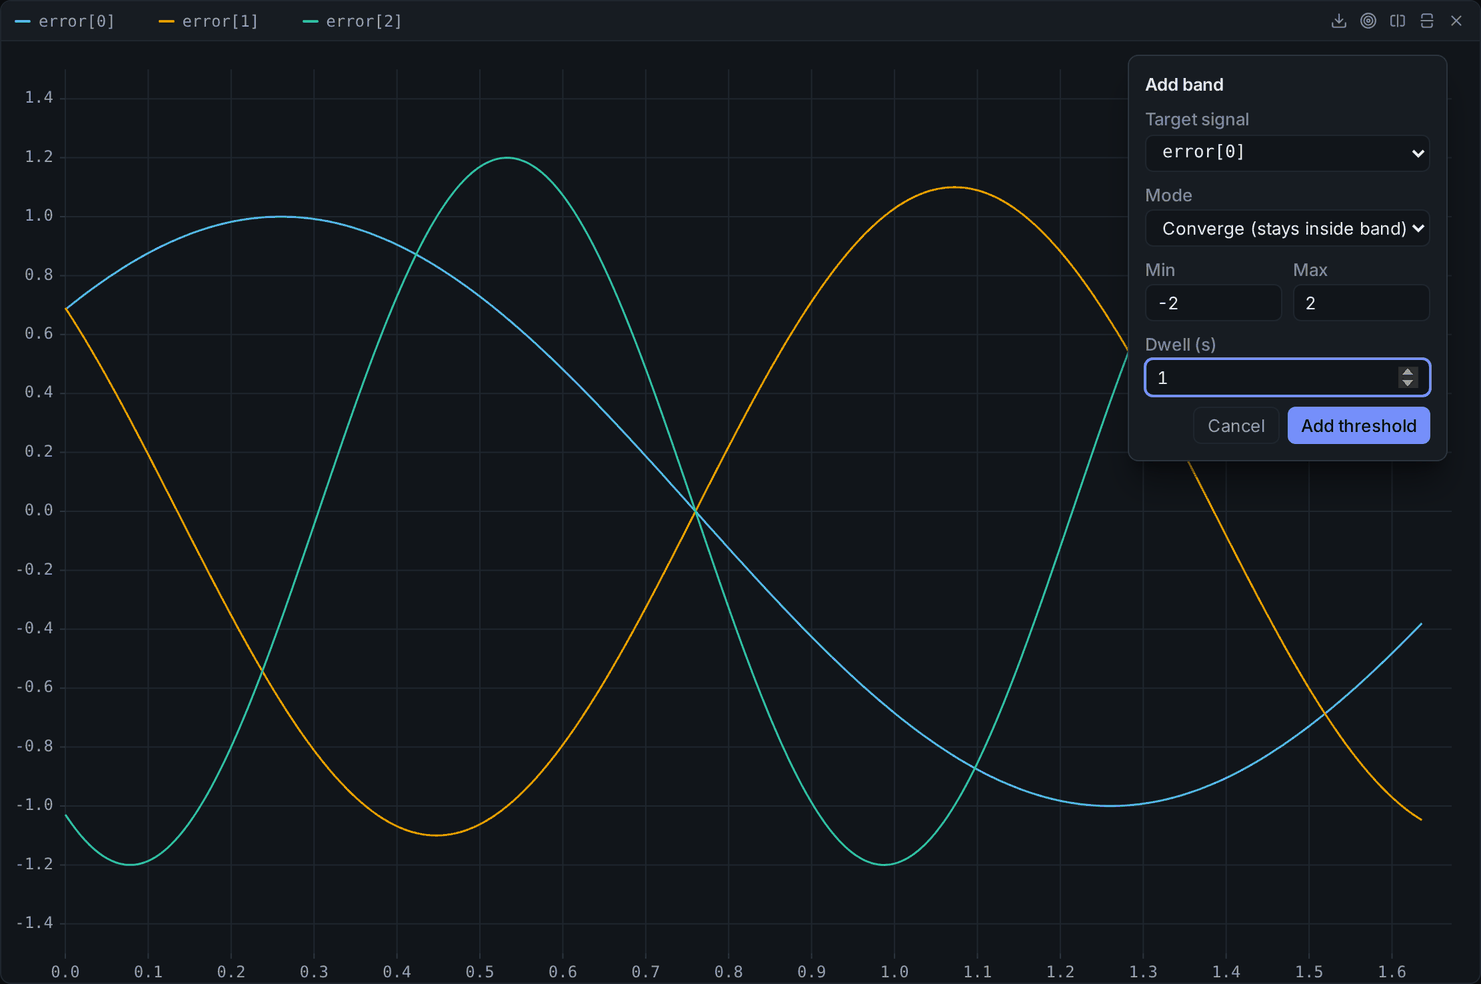
| Field | Meaning |
|---|---|
| Target signal | One of the signals in the pane |
| Mode | Converge: staying inside the band counts as converged. Violate: leaving the band counts as a violation |
| Min · Max | The band. Equal values mean "exactly this value" |
| Dwell (s) | How long the condition must hold. 0 means the first matching sample decides |
When a band decides, a badge appears on the pane: green for converged, red for violated. Click the badge to open its report.
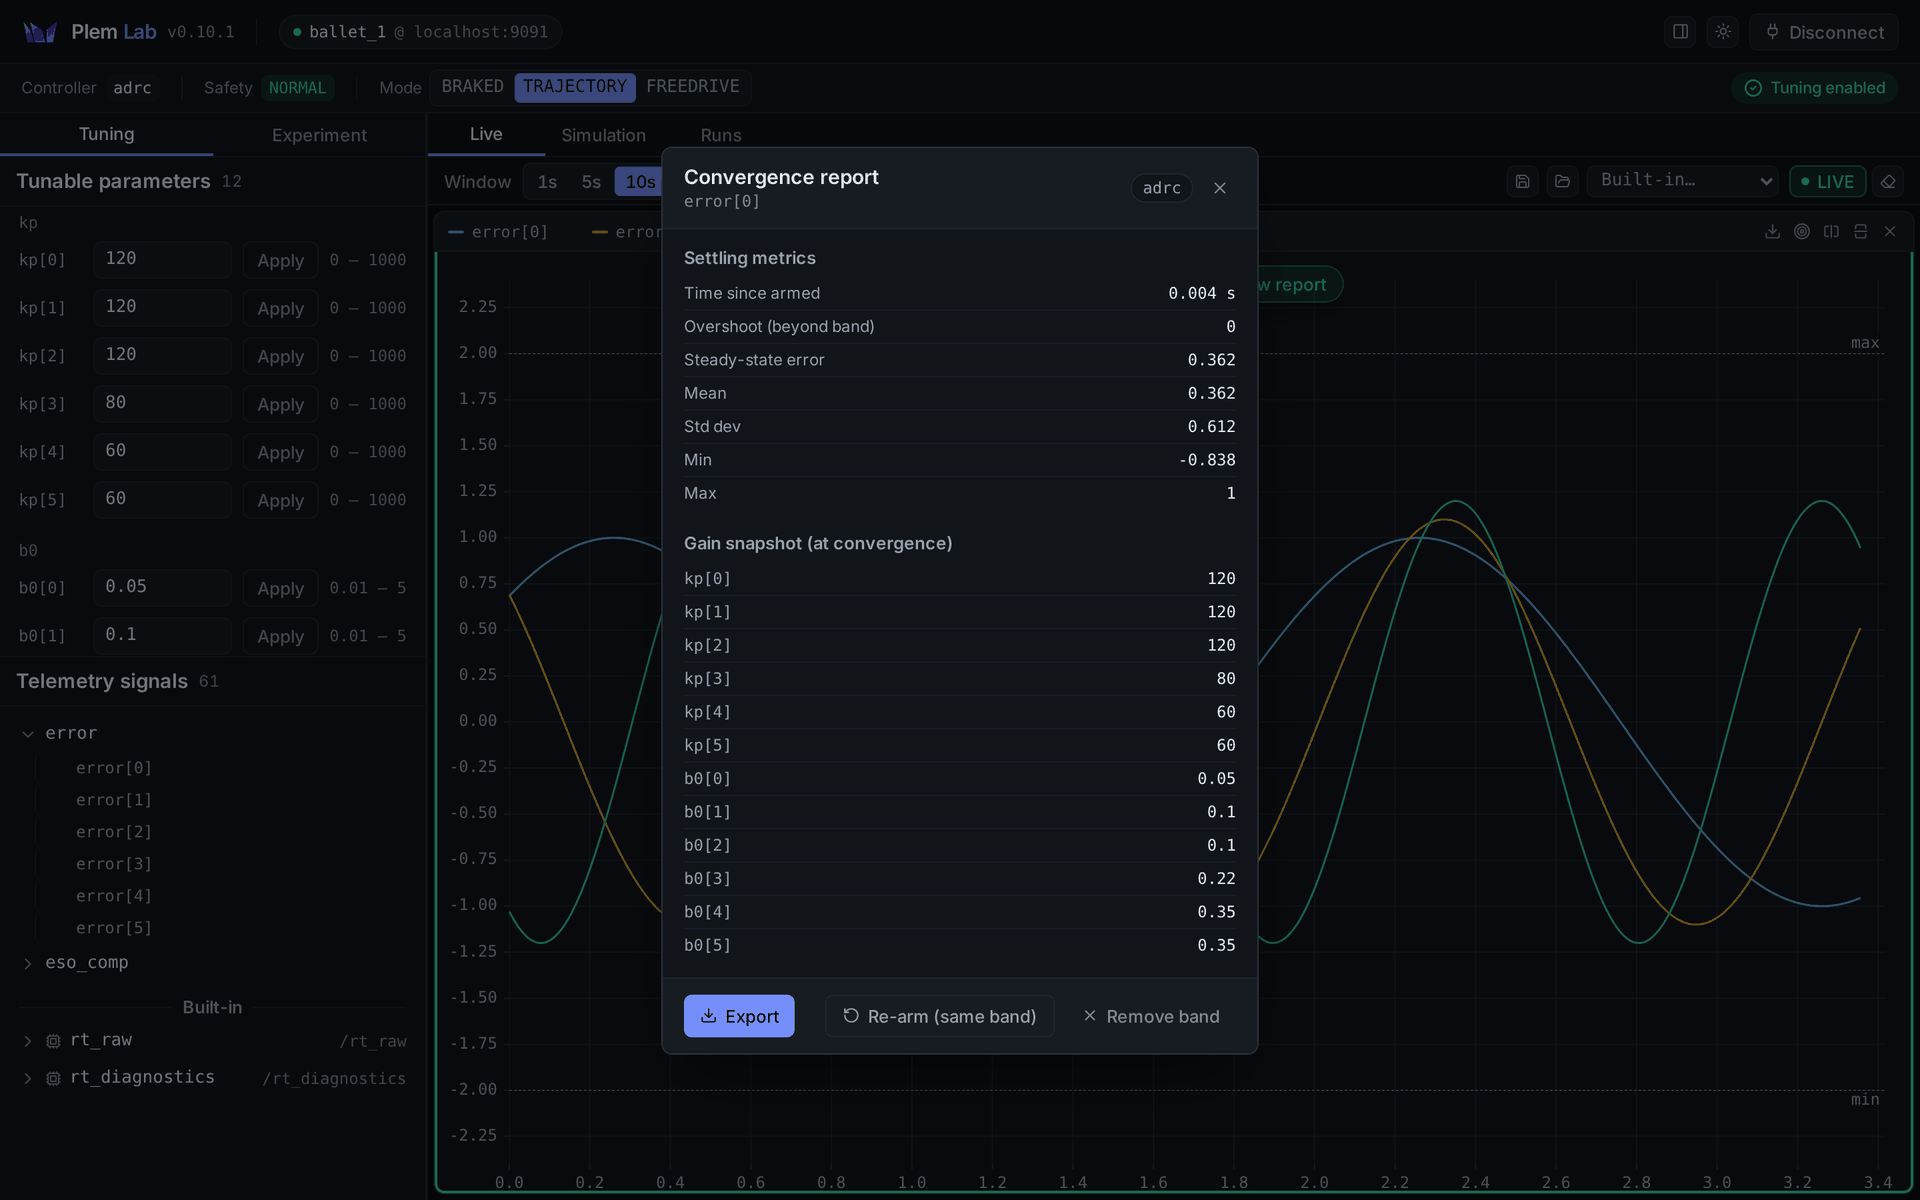
Convergence report
| Item | Meaning |
|---|---|
Time since armed | Time from arming the band to convergence. If you applied a gain after arming, it reads Settling time (since last gain apply) and counts from that apply |
| Overshoot (beyond band) | How far the signal went past the band |
Steady-state error | Mean of all samples since arming, minus the band centre. It is not the error of the settled stretch alone |
| Mean · Std dev · Min · Max | Statistics since arming |
| Gain snapshot | The gains the controller was using, shown when tuning was not locked (see Gains). Otherwise No tuning gains recorded. |
| Button | Action |
|---|---|
| Export | Exports CSV and JSON |
| Re-arm (same band) | Watches again with the same band |
| Remove band | Deletes the band |
| Close (✕, Escape, click outside) | Keeps the band |
Violation report
Shows the time of the first violation, the violation count, the last violation, and whether the data had gaps while watching.
| Button | Action |
|---|---|
| Re-arm (same band) | Resets the count |
| Remove band | Deletes the band |
| Close | Keeps watching |
Gaps in a controller signal do not count toward dwell time. rt_ is different: even with lost samples, the time between neighbouring samples counts in full.