Comparing and exporting runs
The Runs tab collects the runs recorded with Run & capture. Recordings live in this browser and are listed per robot. A browser on another PC does not see them, so export what you need to keep.
A run holds controller signals only. Export built-in signals (rt_, rt_, ft_) from the Live tab with the pane's download button.
Run list
| To | Do this |
|---|---|
| Inspect one run | Click its row, or check one and press Inspect |
| Overlay several | Check them, then Compare (N) |
| Rename | Double-click the name, confirm with Enter |
| Find | Type a run or controller name in the filter |
| Delete | The row's trash icon |
Comparison view
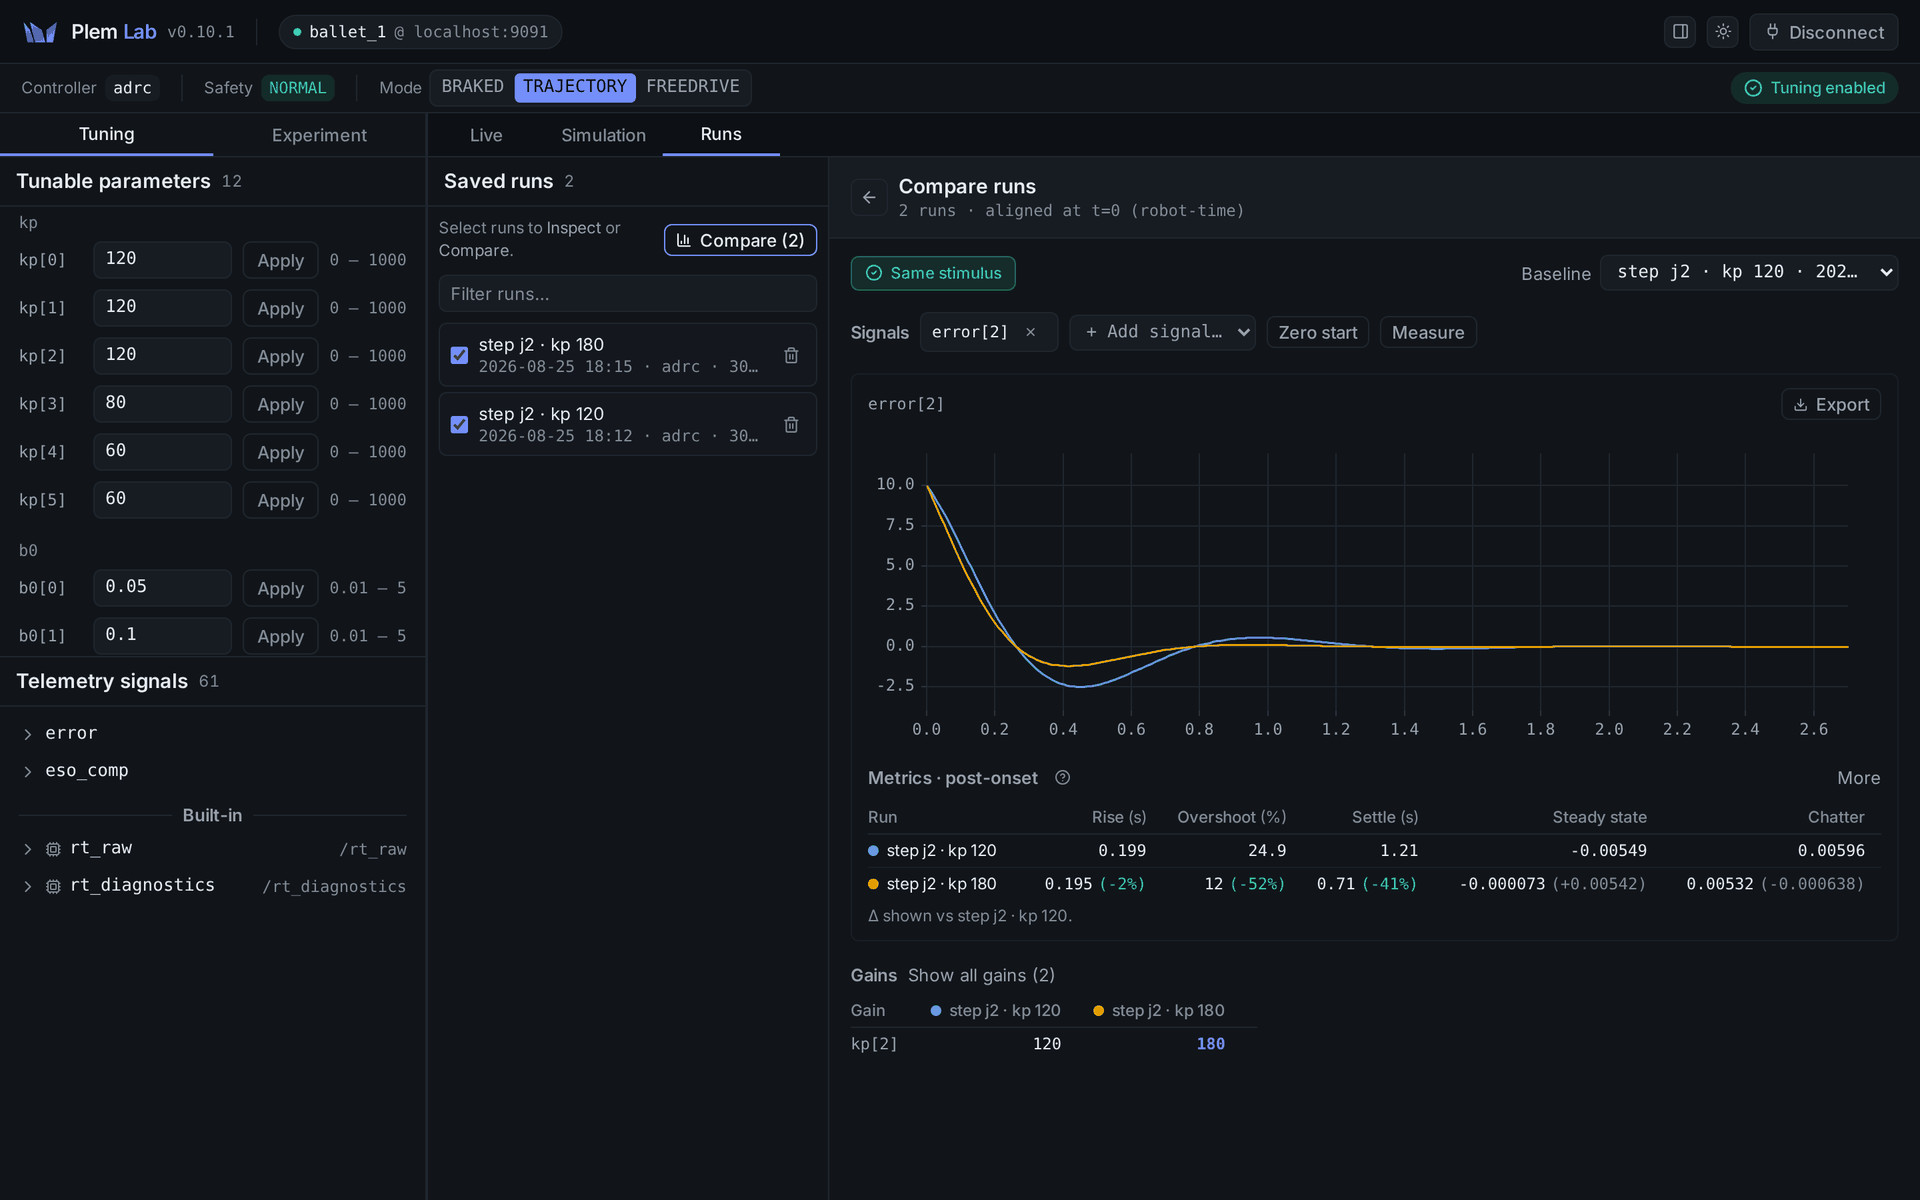
Each run is aligned to t = 0 at its start point. Lab looks for the start point in this order:
- The moment the commanded stimulus starts
- If that is not found, the moment the response starts to move
- If neither is found, the start of the recording
| Control | What it does |
|---|---|
| Stimulus badge | Says whether the stimuli match. Only with Same stimulus are the Δ columns reliable and the Gain sweep shown. With Different stimulus or Stimulus unverified, treat Δ as a rough guide. Hover over the badge to see what differs |
| Baseline | Chooses the run that Δ is measured against |
| Add signal… | Overlays more signals, up to 6 |
| Measure | Click the plot twice to read Δt and Δy between the two points |
| Zero start | Shifts each run so it starts at 0, to compare shape only. A note stays under the plot while it is on. Table values are unchanged |
The tracking error channel (error:…) is plotted by default when the run has one. When you inspect a single run, the result line at the top reads the first plotted signal: Settled, Did not settle or No step outcome.
Metrics
The Metrics table gives statistics for the stretch after the alignment point (t = 0 above). The main columns for the signal come first; press More for the rest.
| Column | Meaning |
|---|---|
| Mean · Std dev · Min · Max · RMS · Peak-to-peak | Descriptive statistics |
| Rise · Overshoot · Settle | Step response metrics. Shown when the stretch looks like a step: the change in the final value is at least 40 % of the full amplitude. A response that never settles shows did not settle |
| Steady state | The settled value, when the last 10 % of the stretch is flat enough. Shown for any stimulus except Sine and Chirp, so Step and Waypoint can have it |
| Amp @freq · Phase @freq | For a sine stimulus: the signal's amplitude, and its phase against the command |
| Chatter | A measure of high-frequency jitter |
| Stretch | Columns shown first |
|---|---|
| Looks like a step (Rise, Overshoot, Settle present) | Rise · Overshoot · Settle · Steady state · Chatter |
| Sine stimulus (Amp @freq present) | Amp @freq · Phase @freq · RMS |
| Anything else | Mean · RMS |
- Analysis columns with no values at all are hidden.
- Values show 3 significant digits, with at most 6 decimal places.
- Values equal to the baseline omit Δ.
- A run with no values in the columns shown first gets
see Morebeside its name, for example a sine run mixed into a step comparison. - For Rise, Overshoot and Settle, Δ shows as a ratio to the baseline, such as
(-40%), but only when the stimuli match. Hover to see the absolute difference.
Pick 3 or more runs with the same stimulus that differ in one gain only, and a Gain sweep plot appears. Runs with tuning locked do not count. The horizontal axis is that gain and the vertical axis is the metric you choose, read from the first plotted signal. It does not appear for two runs, or when more than one gain differs.
Gains
The Gains table shows the gains the controller was using when each run was recorded: one row per gain, one column per run.
A run stores the gains the controller reported when Lab connected, updated each time an apply is confirmed or a read-back confirms a value. Values you typed but did not apply, and values that were refused or failed, are not stored. For a ⚠ row, the read-back value is stored.
- When comparing, only gains that differ between runs are shown, and cells that differ from the baseline are highlighted.
- Show all gains expands the full list and collapses it again.
- With no differing gains, the table reads
Same gains in every run.If runs with tuning locked are mixed in, they are left out of the check and it readsSame gains in every unlocked run. - A run with tuning locked shows
locked.
Exporting
| Where | What it exports |
|---|---|
| The download button on a Live tab pane | That pane's signals, the whole retained buffer |
| Export in the Runs comparison view | The selected runs in full, or each pane's signal compared across runs |
| Export in the convergence report | The settling metrics, plus the gains the controller was using if tuning was not locked |
Every export downloads two files, CSV and JSON, named plemlab_. The format and time base depend on what you export.
| Export | CSV | JSON | Time base |
|---|---|---|---|
| Live | Time in the first column, then the signals | The same data plus robot and controller metadata | Seconds since the session started |
| Convergence report | A metric,value,unit block, followed by a gain,value block when tuning was not locked and gains exist | The report values | No time column |
| Run | Time in the first column, then the signals. The stretch before the alignment point is left out | Includes robot-clock absolute times, the alignment point and the recording time | CSV: seconds from the alignment point. JSON: absolute robot-clock seconds |
| Compare | Time in the first column, one column per run and signal. The same reduced data as on screen. Exports the original values even with Zero start on | The same data | Seconds from the alignment point |
CSV files with a time column open directly in tools such as PlotJuggler.